
In a recent blog post I explored how to monitor the database hosts’ CPU utilization from inside of the Oracle database using the V$OSSTAT view. Although not as comprehensive as native OS tools, the approach offered a quick and simple method for Oracle DBAs to leverage the existing software installed and established network connectivity to overlay a simple host monitoring layer that could track CPU utilization rates, and possibly identify CPU starvation risk, or over-provisioned database hosts in a manner that is largely platform neutral and works regardless of any hypervisor.
In this post I am going to explore how to use how to monitor database IOPS and storage throughput in close-to-real-time, again using the databases’ interval views. Once again our approach will likely not be as comprehensive as native OS tools, but will offer Oracle DBAs a quick and simple additional method to track the storage performance of their databases. In addition, since the Oracle internal views track only the database IO, and not IO generated from other applications, our DBAs can be confident that the numbers represent what the database has generated and is experiencing, undiluted by peripheral activities.
The obvious internal view to consult to check what IO this database is generating is V$FILESTAT:
| Column | Type | Description |
|---|---|---|
| FILE# | NUMBER | ID of the datafile |
| PHYRDS | NUMBER | Physical Reads |
| PHYWRTS | NUMBER | Physical Writes |
| PHYBLKRD | NUMBER | Physical Blocks Read – some IO operations may be multi-block |
| OPTIMIZED_PHYBLKRD | NUMBER | Blocks read from the database smart flash cache |
| PHYBLKWRT | NUMBER | Physical Blocks Written – some IO operations may be multi-block |
| SINGLEBLKRDS | NUMBER | Number of single block reads |
| READTIM | NUMBER | Time (ms) spent on all read operations |
| WRITETIM | NUMBER | Time (ms) spent on all write operations |
| SINGLEBLKRDTIM | NUMBER | Time (ms) spent on single block read operations |
| AVGIOTIM | NUMBER | Average time (ms) on all IO operations since instance start |
| LSTIOTIM | NUMBER | Time (ms) on the last IO operation |
| MINIOTIM | NUMBER | Minimum recorded time (ms) on an IO operation |
| MAXIOTIM | NUMBER | Maximum recorded time (ms) on an IO operation |
| CON_ID | NUMBER | For pluggable databases |
Like the V$OSSTAT we explored in the earlier post, the counters in V$FILESTAT are cumulative, so if we want to calculate database IOPS – input/output operations per second – then we are again going to have to take a reading, wait for a fixed number of seconds, take a second reading, calculate the delta of the two readings and divide that result by the seconds waited.
Using the code from the previous blog post as a template, here is a PL/SQL function to query the GV$FILESTAT view and then report the delta, and below is an example of using that code to report the IOPs from the two-node RAC database.
SET ARRAYSIZE 1
COLUMN PHYRDS    FORMAT 999999999999
COLUMN PHYWRTS   FORMAT 99999999
COLUMN PHYBLKRD  FORMAT 999999999999
COLUMN READ_MBS  FORMAT 99999.99
COLUMN AVG_MS    FORMAT 9999.99

SQL> select to_char(date_time,'HH24:MI:SS') as date_time, PHYRDS, PHYWRTS, PHYBLKRD, READBYTES/1048576 as "READ_MBS", AVG_MS  from table(iostat(5,10));

DATE_TIM        PHYRDS   PHYWRTS      PHYBLKRD  READ_MBS   AVG_MS
-------- ------------- --------- ------------- --------- --------
11:55:39                                                      .05
11:55:44        684401       311        682568   5332.56      .05
11:55:49        688394       385        686271   5361.49      .05
11:55:54        695343       274        693019   5414.21      .05
11:56:00        690583       370        688302   5377.36      .05
11:56:05        697748       478        695335   5432.30      .05
11:56:10        692685       266        690473   5394.32      .05
11:56:15        695967       355        693781   5420.16      .05
11:56:20        701449       287        699280   5463.13      .05
11:56:25        697994       502        695973   5437.29      .05
The GV$FILESTAT view seems to be reports ~700K read IOPs and between 300 and 500 write IOPs from this Swingbench workload with 100 users connected. Let’s compare that to what our storage arrays tells us. In this example our two-node RAC database is using a pair of single engine PowerMax 2500 storage arrays clustered together using SRDF/Metro, which each RAC node mapped to a separate PowerMax, and SRDF/Metro keeping all volumes synced across the two arrays.
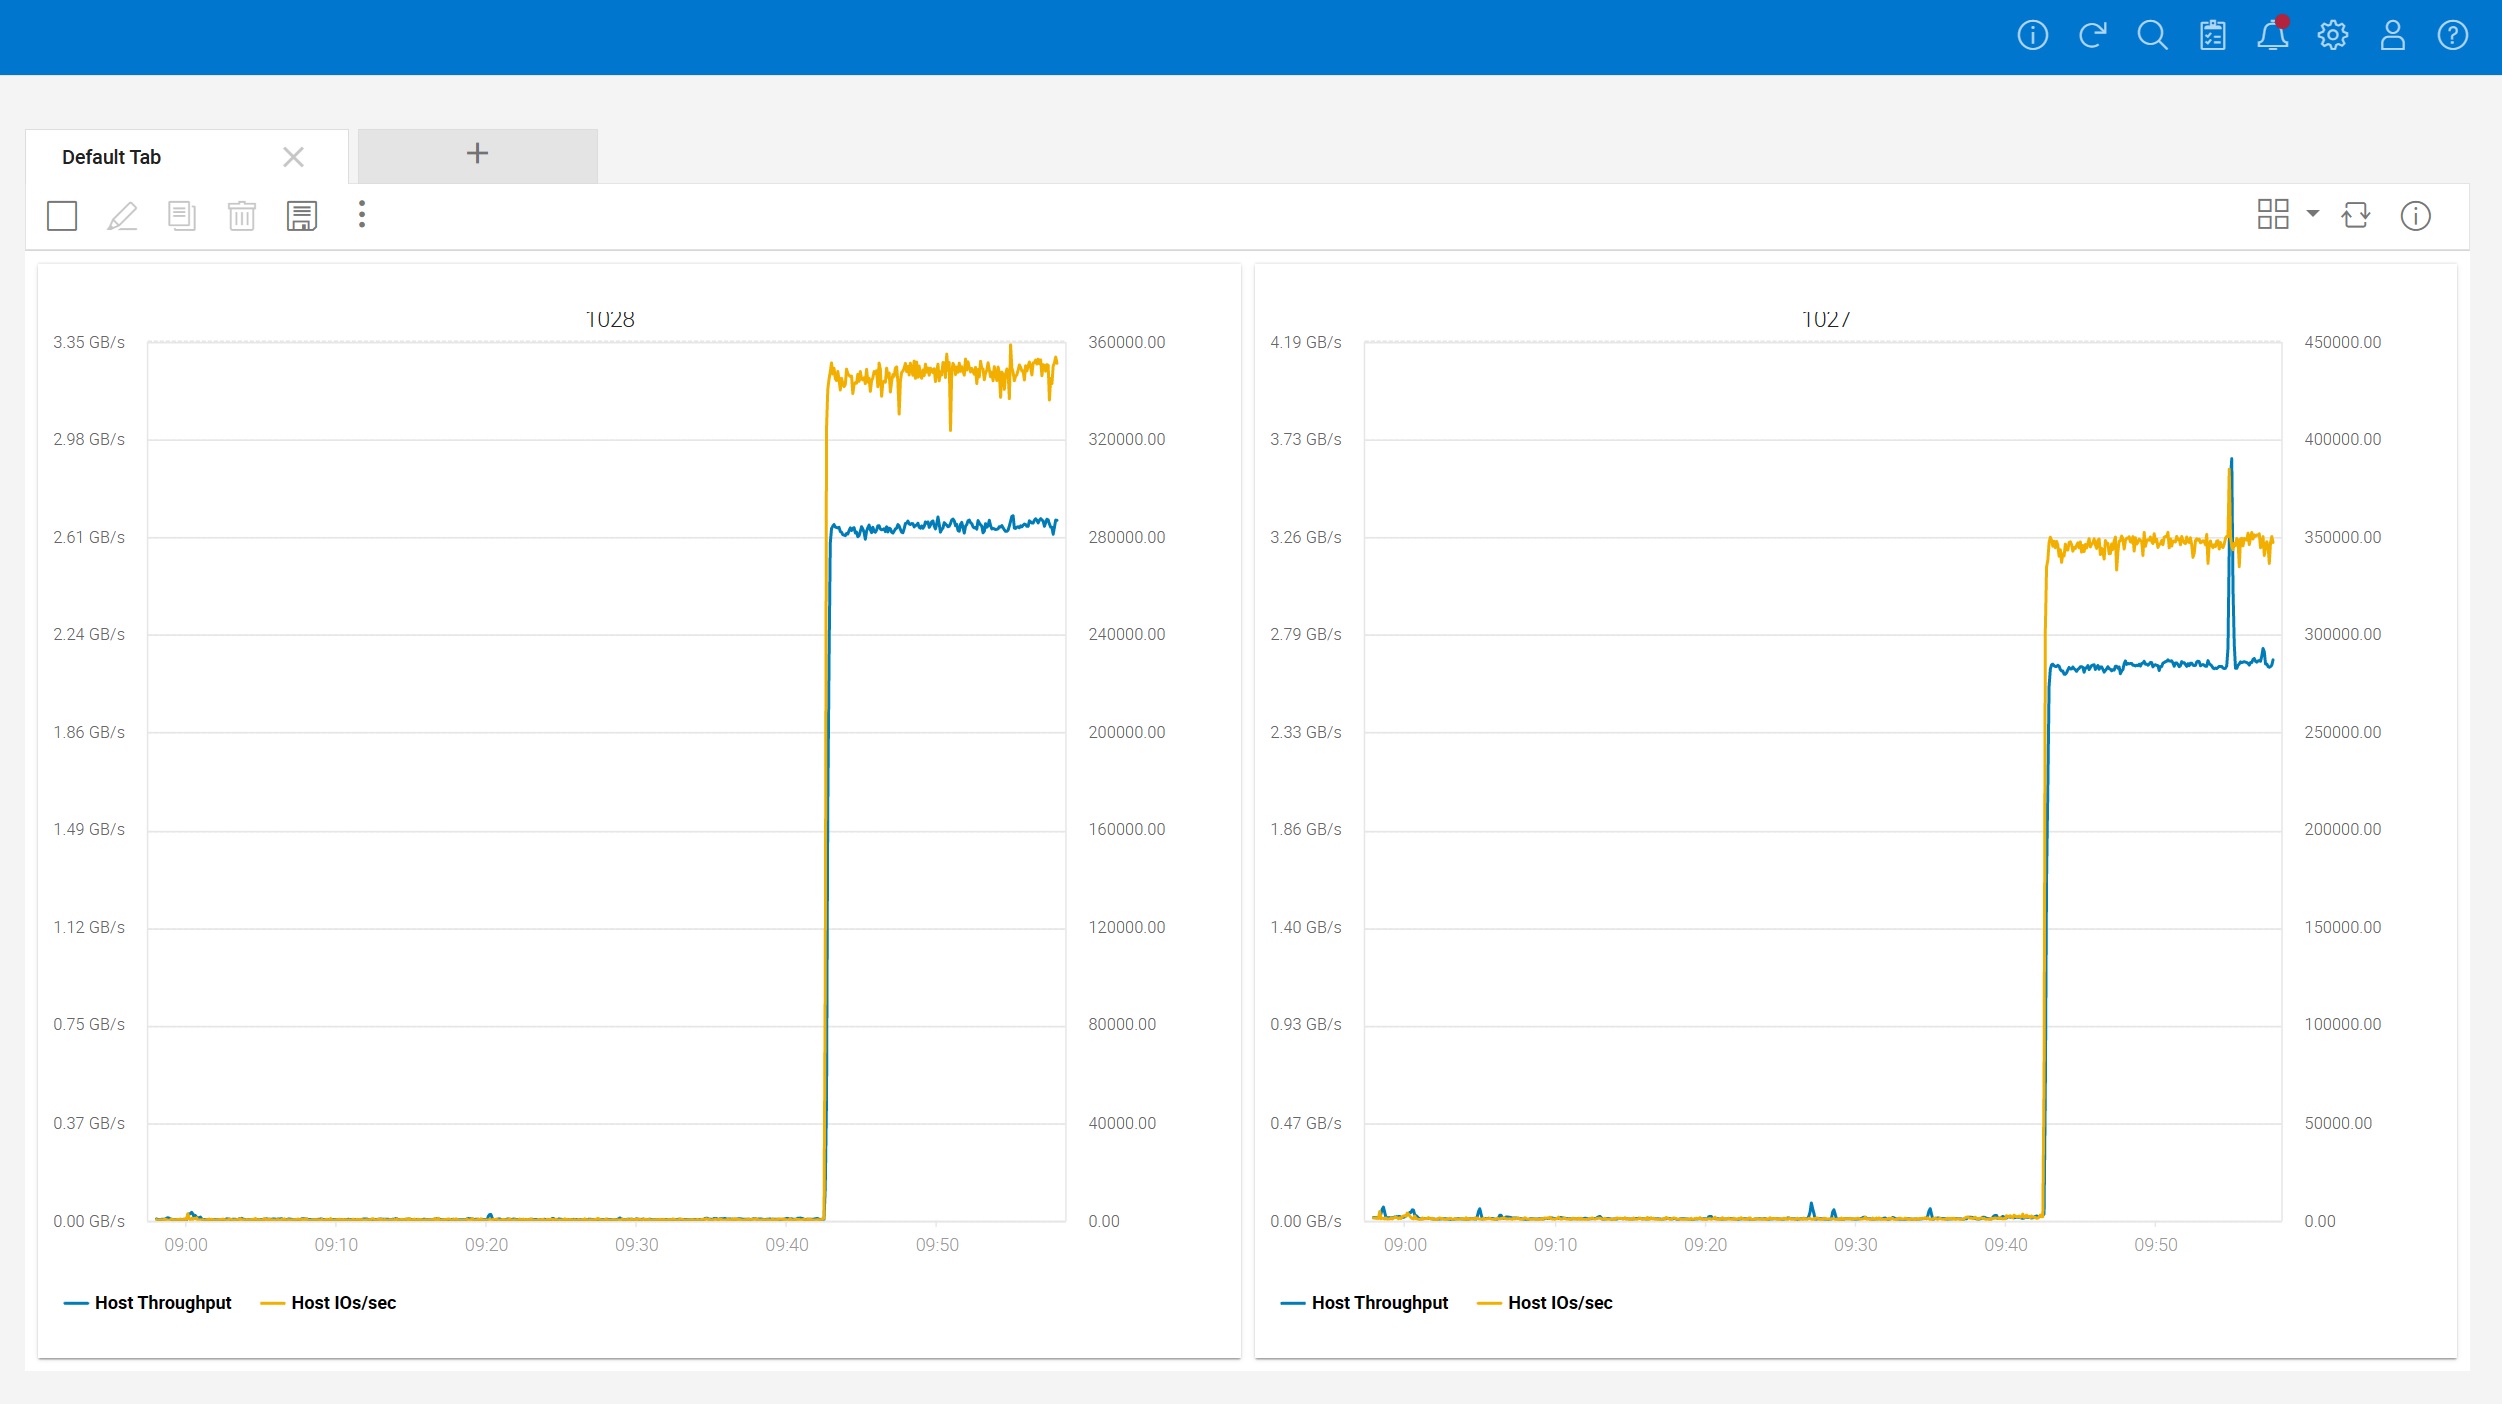
Unisphere reports that each PowerMax is seeing roughly 350,000 IOPs and about 2.7GB/s of throughput which when we consider that each PowerMax is handling about half the load, roughly matches what Oracle is reporting. Although these PowerMax 2500 systems are shared with other projects in the lab, little else was going on at the time of these tests.
However one of the problems with using the GV$FILESTAT view is that the IO stats are only recorded against tablespace datafiles, as evidenced by this simple query:
with iostats_summary as (
  select
    file#,
    con_id,
    sum(fs.phyrds) as phyrds,
    sum(fs.phywrts) as phywrts
  from
    gv$filestat fs
  group by file#, con_id
)
select
  df.file#,
  df.name,
  df.block_size,
  ios.phyrds,
  ios.phywrts
from
  v$datafile df,
  iostats_summary ios,
  v$database vdb
where 1=1
and vdb.con_id=ios.con_id
and vdb.con_id=df.con_id
and ios.file# = df.file#
/

SQL> set linesize 255
SQL> col name format a50
SQL> /

     FILE# NAME                                               BLOCK_SIZE        PHYRDS   PHYWRTS
---------- -------------------------------------------------- ---------- ------------- ---------
         1 +DATA/METRODB/DATAFILE/system.257.1108162531             8192         58895     45445
         2 +DATA/METRODB/DATAFILE/sysaux.258.1108162531             8192        216170    131050
         3 +DATA/METRODB/DATAFILE/undotbs1.259.1108162533           8192        228473    377919
         4 +DATA/METRODB/DATAFILE/undotbs2.261.1108162537           8192         30755       125
         5 +DATA/METRODB/DATAFILE/users.262.1108162539              8192             3         0
         6 +DATA/METRODB/DATAFILE/soe.269.1108222095                8192    1570232080   6712292
         7 +DATA/METRODB/DATAFILE/tpch.277.1111756039               8192             3         0
         8 +DATA/METRODB/DATAFILE/tpch.276.1111756383               8192            12         0
         9 +GCTDATA/METRODB/DATAFILE/gctdata.256.1126008197         8192            34         0
        11 +DATA/METRODB/DATAFILE/tpch.278.1108627309               8192             9         0
        12 +DATA/METRODB/DATAFILE/tpcctab.279.1108895897            8192             2         0
         1 +DATA/METRODB/DATAFILE/system.257.1108162531             8192         22760     13249
         2 +DATA/METRODB/DATAFILE/sysaux.258.1108162531             8192        123708     27457
         3 +DATA/METRODB/DATAFILE/undotbs1.259.1108162533           8192         33407         0
         4 +DATA/METRODB/DATAFILE/undotbs2.261.1108162537           8192        134762    198187
         5 +DATA/METRODB/DATAFILE/users.262.1108162539              8192             1         0
         6 +DATA/METRODB/DATAFILE/soe.269.1108222095                8192     170126897   4057644
         7 +DATA/METRODB/DATAFILE/tpch.277.1111756039               8192             1         0
         8 +DATA/METRODB/DATAFILE/tpch.276.1111756383               8192             1         0
         9 +GCTDATA/METRODB/DATAFILE/gctdata.256.1126008197         8192             1         0
        11 +DATA/METRODB/DATAFILE/tpch.278.1108627309               8192             1         0
        12 +DATA/METRODB/DATAFILE/tpcctab.279.1108895897            8192             1         0
What we do not have here is any IO against redo logs, archivelogs, flashback logs, external tables etc. Fortunately Oracle now gives us another view to consult: GV$IOSTAT_FILE. The GV$IOSTAT_FILE gives records IO against all of the datafiles, but also includes columns for INST_ID so you know which RAC node is generating the IO, and FILETYPE_NAME so you know the type of file:
SQL> select distinct FILETYPE_NAME from gv$iostat_file;

FILETYPE_NAME
----------------------------
Log File
Temp File
Archive Log Backup
Data File Incremental Backup
Flashback Log
Data Pump Dump File
Data File Copy
Other
External Table
Archive Log
Data File Backup
Data File
Control File
Using this better view we can update our earlier PLSQL function to use the GV$IOSTAT_FILE view instead. Now let’s see what numbers we get while Swingbench is running:
SET ARRAYSIZE 1
SET LINESIZE 255
SET PAGESIZE 999

COLUMN SMALL_READS  FORMAT 999999999999
COLUMN SMALL_WRITES FORMAT 99999999
COLUMN LARGE_READS  FORMAT 999999999999
COLUMN LARGE_WRITES FORMAT 99999999
COLUMN SMALL_RMB    FORMAT 999999999999
COLUMN SMALL_WMB    FORMAT 99999999
COLUMN LARGE_RMB    FORMAT 999999999999
COLUMN LARGE_WMB    FORMAT 99999999

SQL> select to_char(date_time,'HH24:MI:SS') as date_time, SMALL_READS, SMALL_WRITES, LARGE_READS, LARGE_WRITES, SMALL_RMB, SMALL_WMB, LARGE_RMB,LARGE_WMB from table(iostat2(5,10));

DATE_TIM   SMALL_READS SMALL_WRITES   LARGE_READS LARGE_WRITES     SMALL_RMB SMALL_WMB     LARGE_RMB LARGE_WMB
-------- ------------- ------------ ------------- ------------ ------------- --------- ------------- ---------
15:36:12
15:36:17        676328          413             0            0          5286         4             0         0
15:36:22        670152          102             0            0          5236         1             0         0
15:36:27        680903          238             0            0          5322         2             0         0
15:36:32        679598          270             0            0          5311         2             0         0
15:36:37        677882          356             0            0          5298         3             0         0
15:36:42        681620          552             0            0          5327         4             0         0
15:36:48        678935          382             0            0          5306         3             0         0
15:36:53        680811          205             0            0          5321         2             0         0
15:36:58        668421          496             0            0          5224         4             0         0
Not much different, but then this is a read-heavy workload that is concentrating most of the IO against the core data files. What happens when we run an RMAN database clone operation:
configure device type disk backup type to backupset parallelism 16;
configure channel device type disk maxopenfiles 1;
configure backup optimization off;

run {
   backup as copy
   section size 256G
   database tag 'MYCOPY' format '+GCTDATA';
}
After we launch this on Node 2 of the RAC, executing our revised IO monitoring code shows about 5.3GB/s of sustained reads, and 5.3GB/s of sustained writes, which is what we would expect given that we have 16 RMAN channels simultaneously reading files and writing out copies to the +GCTDATA ASM diskgroup.
SQL> select to_char(date_time,'HH24:MI:SS') as date_time, SMALL_READS, SMALL_WRITES, LARGE_READS, LARGE_WRITES, SMALL_RMB, SMALL_WMB, LARGE_RMB,LARGE_WMB from table(iostat2(5,10));

DATE_TIM   SMALL_READS SMALL_WRITES   LARGE_READS LARGE_WRITES     SMALL_RMB SMALL_WMB     LARGE_RMB LARGE_WMB
-------- ------------- ------------ ------------- ------------ ------------- --------- ------------- ---------
15:45:21
15:45:27           366           79           623          638             6         1          2475      2552
15:45:32           153            8          1555         1542             2         0          6216      6170
15:45:37           175            2          1367         1358             3         0          5469      5434
15:45:42           208            2          1354         1343             3         0          5417      5374
15:45:47           223            4          1346         1342             3         0          5383      5362
15:45:52           135            3          1342         1350             2         0          5368      5402
15:45:58           133            2          1334         1330             2         0          5335      5321
15:46:03           207            2          1332         1335             3         0          5327      5341
15:46:08           211            2          1339         1341             3         0          5354      5363
10 rows selected.
We should remember that all of the IO numbers shown here are for this database only. Any other instances that might be running on the same host will not be captured here.
Further since we are inspecting the GV$ views, our query will capture IO from the other RAC nodes if they exist. This then will oftentimes not match what might be shown by native Linux tools which will report all IO from the host, but not any database IO from other clustered nodes.

Pingback: Monitoring Oracle Database Performance with Grafana – Part II | the gruffdba