
In a previous blog post I explored how we can use Oracle’s rich V$ views to monitor CPU utilization on the host on which our database is running, as well as the IO generated by all nodes of the database.
Numbers are great, but it would be even better to see the loads represented graphically on a dashboard for an immediate read on how the database and the underlying infrastructure is handling the workload.
In this blog post I will use the Grafana visualization package to create a simple performance dashboard for our Oracle database.
There is a video for this blog
All code is available on GitHub
If you are looking for Part II, you can find it here
According to Wikipedia, “Grafana is a multi-platform open source analytics and interactive visualization web application. It provides charts, graphs, and alerts for the web when connected to supported data sources.” It is available in an enterprise and a freeware version. Whereas the enterprise can connect to a wide variety of data sources, including I believe Oracle, the free version is much more limited.
In this example we are using the freeware version of Grafana which by default allows us to pull data from Loki and PostgreSQL. The ability to query Oracle directly is limited to the enterprise version which requires a license.
So to be able to monitor Oracle, we are going to first need to stage the data in PostgreSQL.
In my previous blog posts I explored using PL/SQL originally developed by Christian Antognini to interrogate the cumulative values of the V$OSSTAT table and calculate deltas to report the current system load of the host.
We could rely on that same approach here, but since we have to pull the data into PostgreSQL to be able to read it in Grafana, it now makes more sense to use PostgreSQL to hold and calculate the delta values, rather than the PL/SQL tables from earlier.
Therefore our strategy will be:
- Read the key metrics in Oracle.
- Insert the key metrics into tables in PostgreSQL.
- Calculate the deltas where relevant and summarize the current performance state
- Purge older data so that the PostgreSQL tables do not grow in size
We will start with the Operating System statistics, which in Oracle are reported in GV$OSSTAT. The query shown below will read the GV$OSSTAT view in Oracle and for each current instance, generate a PostgreSQL insert statement into a table called ORA_OSSTATS:
--
-- reads the gv$osstat view and crafts a Postgres insert statement
--

set linesize 255
set pagesize 9999

select
  'insert into ORA_OSSTATS values('||
  vdb.dbid||','||
  a.inst_id||',now(),'||
  greatest(0,a.value)||','||
  greatest(0,b.value)||','||
  greatest(0,c.value)||','||
  greatest(0,d.value)||','||
  greatest(0,e.value)||','||
  greatest(0,f.value)||','||
  greatest(0,g.value)||','||
  greatest(0,h.value)||','||
  greatest(0,i.value)||','||
  greatest(0,j.value)||','||
  greatest(0,k.value)||');' "-- postgres insert"
from
  v$database vdb,
  gv$osstat a,
  gv$osstat b,
  gv$osstat c,
  gv$osstat d,
  gv$osstat e,
  gv$osstat f,
  gv$osstat g,
  gv$osstat h,
  gv$osstat i,
  gv$osstat j,
  gv$osstat k
where 1=1
--
and a.con_id=0
and a.con_id=b.con_id
and a.con_id=c.con_id
and a.con_id=d.con_id
and a.con_id=e.con_id
and a.con_id=f.con_id
and a.con_id=g.con_id
and a.con_id=h.con_id
and a.con_id=i.con_id
and a.con_id=j.con_id
and a.con_id=k.con_id
--
and a.inst_id = b.inst_id
and a.inst_id = c.inst_id
and a.inst_id = d.inst_id
and a.inst_id = e.inst_id
and a.inst_id = f.inst_id
and a.inst_id = g.inst_id
and a.inst_id = h.inst_id
and a.inst_id = i.inst_id
and a.inst_id = j.inst_id
and a.inst_id = k.inst_id
--
and a.stat_name = 'SYS_TIME'
and b.stat_name = 'USER_TIME'
and c.stat_name = 'IOWAIT_TIME'
and d.stat_name = 'IDLE_TIME'
and e.stat_name = 'BUSY_TIME'
and f.stat_name = 'NUM_CPU_SOCKETS'
and g.stat_name = 'NUM_CPU_CORES'
and h.stat_name = 'NUM_CPUS'
and i.stat_name = 'LOAD'
and j.stat_name = 'PHYSICAL_MEMORY_BYTES'
and k.stat_name = 'FREE_MEMORY_BYTES'
--
order by a.inst_id
/
Running this code against my two-node Oracle RAC database, I get the following output:
insert into ORA_OSSTATS values (2053389406,1,now(), 15897774,23321608,599382,9103097569,39443135,4,72,72,18.4296875,606859923456,552938467328);
insert into ORA_OSSTATS values (2053389406,2,now(), 14265091,18642290,205079,8827048846,33112126,4,72,72,19.6298828125,607916888064,548879101952);
Note: The following is the code to create the ORA_OSSTATS table in PostgreSQL:
create table if not exists ORA_OSSTATS(
  dbid       varchar(50) not null,
  inst_id    varchar(50) not null,
  ts         timestamptz not null,
  sys_val    real not null,
  usr_val    real not null,
  iow_val    real not null,
  idl_val    real not null,
  bsy_val    real not null,
  sockets    int not null,
  cores      int not null,
  cpus       int not null,
  load       real not null,
  total_ram  bigint not null,
  free_ram   bigint not null
);
So we can create a loop to poll the GV$OSSTAT table and insert the results into the PostgreSQL table every five seconds or so. Once our loop has been running a few minutes we can query the PostgreSQL table and see the OS values recorded by Oracle.
psql=# select * from ORA_OSSTATS order by ts;

    dbid    | inst_id |              ts               |   sys_val   |   usr_val   | iow_val |   idl_val   |   bsy_val   | sockets | cores |
 cpus |   load    |  total_ram   |   free_ram
------------+---------+-------------------------------+-------------+-------------+---------+-------------+-------------+---------+-------+
------+-----------+--------------+--------------
 2053389406 | 1       | 2023-10-11 17:50:58.475835-05 | 1.57859e+07 | 2.32279e+07 |  598113 | 9.10209e+09 | 3.91325e+07 |       4 |    72 |
   72 |  0.179688 | 606859923456 | 554140557312
 2053389406 | 2       | 2023-10-11 17:50:58.476835-05 | 1.41544e+07 | 1.85313e+07 |  204549 | 8.82607e+09 | 3.27789e+07 |       4 |    72 |
   72 |  0.369141 | 607916888064 | 550122770432
 2053389406 | 1       | 2023-10-11 17:51:04.835935-05 |  1.5786e+07 | 2.32281e+07 |  598113 | 9.10214e+09 | 3.91328e+07 |       4 |    72 |
   72 |   0.15918 | 606859923456 | 554129592320
 2053389406 | 2       | 2023-10-11 17:51:04.836897-05 | 1.41545e+07 | 1.85314e+07 |  204550 | 8.82612e+09 | 3.27791e+07 |       4 |    72 |
   72 |  0.339844 | 607916888064 | 550120644608

[output removed to aid clarity]

 2053389406 | 1       | 2023-10-11 17:53:55.547098-05 |  1.5892e+07 | 2.33168e+07 |  599315 | 9.10307e+09 | 3.94277e+07 |       4 |    72 |
   72 |   18.2891 | 606859923456 | 552834629632
 2053389406 | 2       | 2023-10-11 17:53:55.54812-05  | 1.42597e+07 | 1.86367e+07 |  205049 | 8.82702e+09 | 3.30957e+07 |       4 |    72 |
   72 |   19.0693 | 607916888064 | 548837613568
 2053389406 | 1       | 2023-10-11 17:54:02.248817-05 | 1.58978e+07 | 2.33216e+07 |  599382 |  9.1031e+09 | 3.94431e+07 |       4 |    72 |
   72 |   18.4297 | 606859923456 | 552938467328
 2053389406 | 2       | 2023-10-11 17:54:02.24985-05  | 1.42651e+07 | 1.86423e+07 |  205079 | 8.82705e+09 | 3.31121e+07 |       4 |    72 |
   72 |   19.6299 | 607916888064 | 548879101952
(58 rows)
The values recorded are exactly the values read from Oracle.
If you read my earlier blog post Calculating Host Utilization using V$OSSTAT, then you may recall many of these values are cumulative values calculated from instance start up. This is the case for SYS_TIME, USER_TIME, IOWAIT_TIME, IDLE_TIME and BUSY_TIME.
Therefore to obtain the actual values for the time stamp, we need to subtract the previously recorded value which will reveal the delta. In the case of an instance restart, the cumulative values reset to zero, meaning that subtracting the previous value would yield a negative number. Since we are seeking to graph the values in real time, we do not want negative values creating a malformed dashboard. Hence we will ensure that any of the delta values can never be less than zero.
Below is PostgreSQL code to calculate the deltas, and then insert the result into a second PostgreSQL table called ORA_OSSTATS_DELTA.
with mystats as (
select
  DBID,
  TS,
  INST_ID,
  SYS_VAL,
  USR_VAL,
  IOW_VAL,
  IDL_VAL,
  BSY_VAL,
  SOCKETS,
  CORES,
  CPUS,
  LOAD,
  TOTAL_RAM,
  FREE_RAM,
  row_number() over (partition by DBID, INST_ID order by TS desc) as rnk
from ORA_OSSTATS
)
insert into ORA_OSSTATS_DELTA (
select
  a.DBID,
  a.INST_ID,
  a.TS,
  cast( extract(epoch from(a.TS-b.TS)) as integer) "ELAPSED",
  greatest(0,a.SYS_VAL-b.SYS_VAL) "SYS_VAL",
  greatest(0,a.USR_VAL-b.USR_VAL) "USR_VAL",
  greatest(0,a.IOW_VAL-b.IOW_VAL) "IOW_VAL",
  greatest(0,a.IDL_VAL-b.IDL_VAL) "IDL_VAL",
  greatest(0,a.BSY_VAL-b.BSY_VAL) "BSY_VAL",
  a.SOCKETS,
  a.CORES,
  a.CPUS,
  a.LOAD,
  a.TOTAL_RAM,
  a.FREE_RAM
from
  mystats a, mystats b
where 1=1
and a.dbid=b.dbid
and a.inst_id=b.inst_id
and a.rnk=1 and b.rnk=2
);
The delta generation script needs to be run immediately after the data has been inserted from the Oracle. In my GitHub repo I include a simple shell script to connect to Oracle, generate the data scrape, connect to PostgreSQL, insert the data, and then calculate the deltas. This code runs in a loop with a five second delay between executions. This will create a constant feed of OS performance data into PostgreSQL. The GitHub also has the code to create the ORA_OSSTATS and ORA_OSSTATS_DELTA tables in PostgreSQL.
After the script has run for a few mins we can inspect our PostgreSQL table to see how the Oracle host metrics have changed over time:
psql=# select * from ORA_OSSTATS_DELTA order by ts;
    dbid    | inst_id |              ts               |  elapsed  |   sys_val   |   usr_val   | iow_val |   idl_val   |   bsy_val   | socke
ts | cores | cpus |   load    |  total_ram   |   free_ram
------------+---------+-------------------------------+-----------+-------------+-------------+---------+-------------+-------------+------
---+-------+------+-----------+--------------+--------------
 2053389406 | 1       | 2023-10-11 17:50:58.475835-05 | 1.173e+06 | 1.44828e+07 | 2.13617e+07 |  558915 | 8.39494e+09 | 3.59107e+07 |
 4 |    72 |   72 |  0.179688 | 606859923456 | 554140557312
 2053389406 | 2       | 2023-10-11 17:50:58.476835-05 | 1.173e+06 | 1.31274e+07 | 1.72782e+07 |  195276 | 8.40135e+09 |   3.045e+07 |
 4 |    72 |   72 |  0.369141 | 607916888064 | 550122770432
 2053389406 | 1       | 2023-10-11 17:51:04.835935-05 |         6 |         147 |         152 |       0 |       48128 |         300 |
 4 |    72 |   72 |   0.15918 | 606859923456 | 554129592320
 2053389406 | 2       | 2023-10-11 17:51:04.836897-05 |         6 |         115 |         118 |       1 |       48128 |         232 |
 4 |    72 |   72 |  0.339844 | 607916888064 | 550120644608

[output removed to aid clarity]

 2053389406 | 1       | 2023-10-11 17:53:55.547098-05 |         7 |        5677 |        4770 |      41 |       31744 |       15900 |
 4 |    72 |   72 |   18.2891 | 606859923456 | 552834629632
 2053389406 | 2       | 2023-10-11 17:53:55.54812-05  |         7 |        5632 |        5716 |      33 |       30720 |       17082 |
 4 |    72 |   72 |   19.0693 | 607916888064 | 548837613568
 2053389406 | 1       | 2023-10-11 17:54:02.248817-05 |         7 |        5751 |        4788 |      67 |       31744 |       15404 |
 4 |    72 |   72 |   18.4297 | 606859923456 | 552938467328
 2053389406 | 2       | 2023-10-11 17:54:02.24985-05  |         7 |        5368 |        5586 |      30 |       30720 |       16426 |
 4 |    72 |   72 |   19.6299 | 607916888064 | 548879101952
(58 rows)
It is this ORA_OSSTATS_DELTA table we will now use to populate our Grafana dashboard.
I will add a new data source to Grafana that connects to my PostgreSQL database. To do this I will of course need to allow remote connections to PostgreSQL by editing the postgres.conf file and restarting PostgreSQL.
Once that is done, I can create a new Grafana dashboard and add a new panel.
In my example, I am going to set the data source to my newly added PostgreSQL database and add a Bar Gauge. The “from table” will be ORA_OSSTATS_DELTA and the time column will be TS. The column value will be IDL_VAL. This should produce a image similar to this:
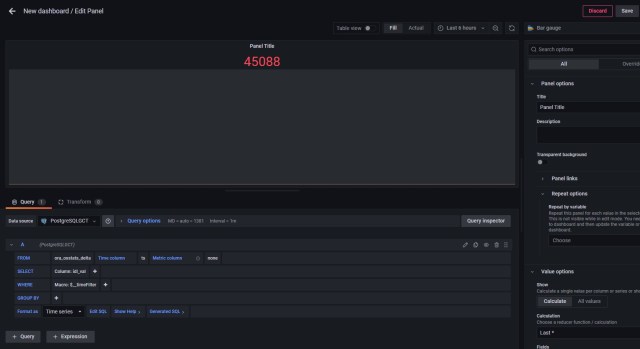
Grafana is reading the last value recorded for IDL_VAL from the ORA_OSSTATS_DELTA. There are several issues I need to resolve:
The ORA_OSSTATS_DELTA records metrics for all nodes of the RAC cluster. I have a two-node RAC, and since I am building a dashboard for Node 1, I need to limit my query to node 1.
To get the percentage idle, I need to divide the idle time by the sum of idle time and busy time.
Oracle treats IO waits as a component of idle time, but Linux does not. If I want my dashboard value to match what Linux reports, I am going to need to subtract IO wait time from idle time.
All of the above could be addressed in the code that queries Oracle, but this would add load to the monitored system and add to a Heisenberg effect. I could also have addressed it in the PostgreSQL code that calculated the deltas. But Grafana provides a rich query environment, where we can add a layer of data quality enforcement.
Use the Edit SQL button in Grafana and add the necessary calculations:
SELECT
  ts AS "time",
  ((idl_val-iow_val)/(bsy_val+idl_val))*100 "PCT_IDL"
FROM ora_osstats_delta
WHERE
  $__timeFilter(ts)
  AND inst_id='1'
ORDER BY 1
We should now see a graphical bar chart representation of the current idle time of the host of the first RAC node. In my example I made a few adjustments to the Bar Gauge to better display the data. These are subjective issues and the reader is encourage to explore and experiment. Here were my choices:
- Under Panel Options, set the title to “Node 1 System Load”
- Under Standard Options, set the Max value to 100.
- Under Standard Options, set the Color Scheme to Classic Palette.
- Under Thresholds, disable the 80% threshold so that the bar gauge remains a single color.
Now let’s add the other key metrics we want to display on our dashboard; the percentage of system time, percentage of user process time, and the percentage of IO wait time on the host system. Using Grafana, edit the SQL again and change the code as follows:
SELECT
  ts AS "time",
  ((idl_val-iow_val)/(bsy_val+idl_val))*100 "PCT_IDL",
  (sys_val/(bsy_val+idl_val))*100 "PCT_SYS",
  (usr_val/(bsy_val+idl_val))*100 "PCT_USR",
  (iow_val/(bsy_val+idl_val))*100 "PCT_IOW"
FROM ora_osstats_delta
WHERE
  $__timeFilter(ts)
  AND inst_id='1'
ORDER BY 1
Grafana should show us 4 bars, in different colors, with the values. Try adding a load to the host system and watch as the graph responds. Remember there will be up to a five-second delay between graph updates.

In my example, I then cloned this panel and edited the SQL to pull data for Node 2. Now I have real time monitoring of the system load of both nodes of my RAC cluster. Using Swingbench, I can generate a load and watch as the dashboard responds in real time. If I shut down one node of my RAC, Swingbench will automatically reconnect the failed sessions to the surviving node, and again I can watch as the load increases.
But I will also get a graphing error on the stopped node, with “divide by zero” errors. Again the cumulative nature of the source data, and the delta calculations, can mean that we can end up trying to divide by zero. Its also good practice anytime we perform a divide operation that we ensure the operator cannot be zero. So I need to edit my SQL code in Grafana to trap for that:
SELECT
  ts AS "time",
  ((idl_val-iow_val)/greatest(1,(bsy_val+idl_val)))*100 "PCT_IDL",
  (sys_val/greatest(1,(bsy_val+idl_val)))*100 "PCT_SYS",
  (usr_val/greatest(1,(bsy_val+idl_val)))*100 "PCT_USR",
  (iow_val/greatest(1,(bsy_val+idl_val)))*100 "PCT_IOW"
FROM ora_osstats_delta
WHERE
  $__timeFilter(ts)
  AND inst_id='1'
ORDER BY 1
Now if I start both database nodes, spin up a Swingbench workload, and then stop one node, my Grafana dashboard should show the load moving dynamically from the stopped node to the surviving node.
The ORA_OSSTATS_DELTA table also includes the number of CPU sockets (SOCKETS), CPU cores (CORES) and CPU threads (CPUS) as well as the total RAM for each database node. These metrics were also read from GV$OSSTATS in Oracle but are not cumulative.
We could have stored them in a separate PostgreSQL table where delta calculations were not needed for the cumulative metrics. But in real world applications, data is often presented to us in less than optimal fashion, so let’s see if we can read the non-cumulative metrics from the ORA_OSSTATS_DELTA table and present them in a meaningful manner.
I will add a new panel to my Grafana dashboard and select a Table control. For this panel I will read from my PostgreSQL database and again select the ORA_OSSTATS_DELTA table as my data source. Set the time columns to TS, and selecting INST_ID and SOCKETS from the source table. Then change the format to TABLE, and I see something like this:
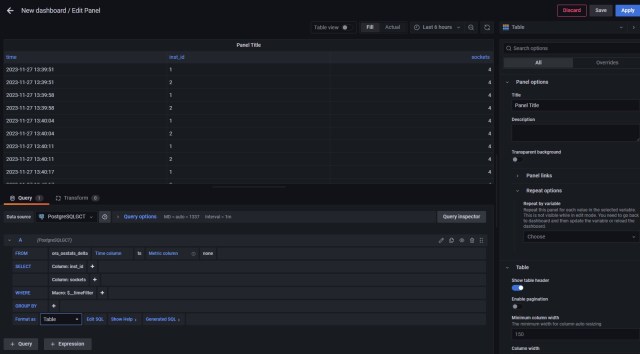
Grafana is showing me the CPU socket count for each database node at the time the data was collected. What I want to see is the data for each node for right now. So I will edit the SQL as follows:
with mystats as (
SELECT
ts AS "time",
dbid,
inst_id,
sockets,
row_number() over (partition by DBID,INST_ID order by TS desc) as rnk
FROM ora_osstats_delta
)
select
inst_id as "node",
sockets
from mystats
where rnk=1
In the WITH clause I am partitioning the result set on the DBID and INST_ID columns and then ordering by TS (time) descending, meaning the newest data will be at the top. Then in the select statement using the rank column to select only row 1.
I can now expand this approach to add in the other non-cumulative columns:
with mystats as (
SELECT
ts AS "time",
dbid,
inst_id,
sockets,
cores,
cpus,
total_ram/1048576/1024 as "total_ram_gb",
row_number() over (partition by DBID,INST_ID order by TS desc) as rnk
FROM ora_osstats_delta
)
select
inst_id as "node",
sockets,
cores,
cpus,
total_ram_gb
from mystats
where rnk=1
Grafana reports correctly that my two database host each comprise four sockets with a total of 72 cores (2x36c). Hyper threading is not enabled on this server so we see 72 threads – which Oracle reports as CPUs. Each machine reports about 560GB of RAM.

It would be helpful to know how many sessions are connected to each database node, so let’s add that option. Again let’s craft the PostgreSQL insert statement in Oracle when we read the GV$SESSION table. In our example below, we only care about connections from Swingbench which use the SOE user id. We want to know how many SOE connections there are to each of the RAC nodes.
One issue to look for is that if there are no SOE connections to a given node, the first part of our SQL would return nothing. Instead I want an actual “0” to show up in Grafana because it looks more uniform. Additionally a “zero” on the monitor shows we checked and found nothing, rather than a blank entry which might indicate the query failed to run at all. So my code includes a UNION-ALL to a second SQL statement to return a zero when there are no SOE connections to a given RAC node:
--
-- reads the gv$session view and craft a PostgreSQL insert statement
--

select
  'insert into ORA_SESSIONS_NOTIME values('||
  vdb.dbid||','||
  gvs.inst_id||','||
  count(*)||') on conflict ( dbid,inst_id ) do update set users='||count(*)||';' "-- pg cmd"
from
  gv$session gvs,
  v$database vdb
where username = 'SOE'
group by vdb.dbid, gvs.inst_id
union all
select
  'insert into ORA_SESSIONS_NOTIME values('||
  vdb.dbid||','||
  vt.thread#||',0) on conflict ( dbid,inst_id ) do update set users=0;' "-- pg cmd"
from
  v$thread vt,
  v$database vdb
where not exists ( select 1 from gv$session gvs where gvs.username = 'SOE' and gvs.inst_id = vt.thread# )
group by vdb.dbid, vt.thread#
/
Running this against my two-node Oracle RAC database while Swingbench is running with 60 sessions produces the following result:
-- pg cmd
-------------------------------------------------------------------------------------------------------------------------------------------------------------------------------------------------------------------------------------------------------------
insert into ORA_SESSIONS_NOTIME values(2053389406,1,30) on conflict ( dbid,inst_id ) do update set users=30;
insert into ORA_SESSIONS_NOTIME values(2053389406,2,30) on conflict ( dbid,inst_id ) do update set users=30;
Note, I have not included the PostgreSQL date-time function “now()”, as this will not be time-series data. Since it is not time-series data, I will want the code to insert if there is no current entry for a given database and instance ID, and update the entry if it already exists. In Oracle we call this operation an UPSERT, and in PostgreSQL we can achieve the same result using the “on conflict” clause as shown.
Also note that the values are not cumulative. Therefore there is no need to generate deltas. The ORA_SESSIONS_NOTIME PostgreSQL table can be directly read by Grafana.
Adding a new panel to our Grafana dashboard I again choose to use the table control, and the ORA_SESSIONS_NOTIME as the table to read from. The format is not “Time Series”, so I will change this to type to table, but the Grafana interface will still complain there is no TIME column. So at this point I will edit the SQL directly to read:
SELECT
  inst_id as "Database Node",
  users as "Connected Users"
FROM ora_sessions_notime
ORDER BY 1

If I now shut down one of my RAC nodes I can watch as the sessions fail over to the surviving node as the load on stopped node drops to zero, and the load on the surviving node climbs as Swingbench connects new sessions:


Pingback: Monitoring Oracle Database Performance with Grafana – Part II | the gruffdba